Systems Performance - Enterprise and the Cloud
- Chapter 5 is probably worth rereading when debugging something at the application level
- Progress
- Stopped chapter 2 at pg 58, stopped chapter 6 at pg 241
- Read chapters 1, 3-5
1. Introduction
-
“Full stack” *
The term full stack is sometimes used to describe only the application environment, including databases, applications, and web servers. When speaking of systems performance, however, we use full stack to mean the entire software stack from the application down to metal (the hardware), including system libraries, the kernel, and the hardware itself. Systems performance studies the full stack.
-
-
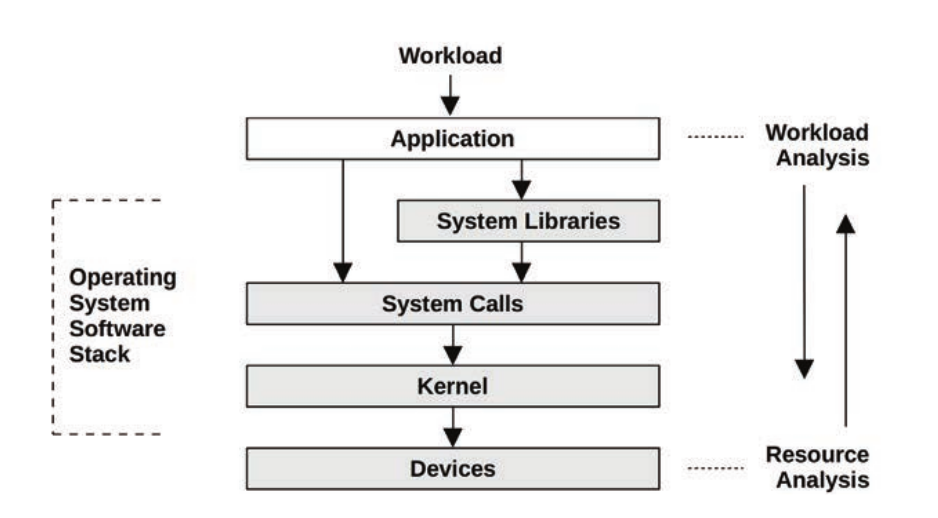
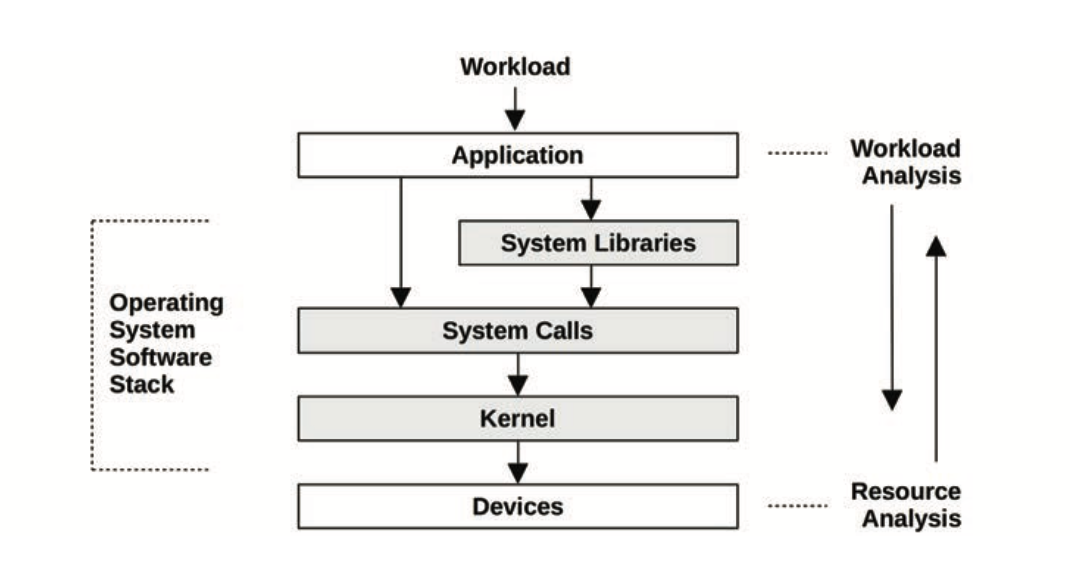
Workload analysis vs resource analysis, approaching the problem from either end
-
-
Bottlenecks can also be complex and related in unexpected ways; fixing one may simply move the bottleneck elsewhere in the system
-
Observability vs. experimental tools
-
-
Profiling vs Tracing
- Profiling: perform sampling: taking a subset (a sample) of measurements to paint a coarse picture of the target
- Tracing: event-based recording, where event data is captured and saved for later analysis or consumed on-the-fly for custom summaries and other actions
-
The linux kernel has hundreds of “tracepoints” (static instrumentation) but also has things like kprobes/BPF (dynamic instrumentation)
-
USDT (user statically defined tracing) is a technology (what is this though, a library?) that allows user-space code to set up tracepoints
-
Methodologies
- Checklists > randomly rooting around
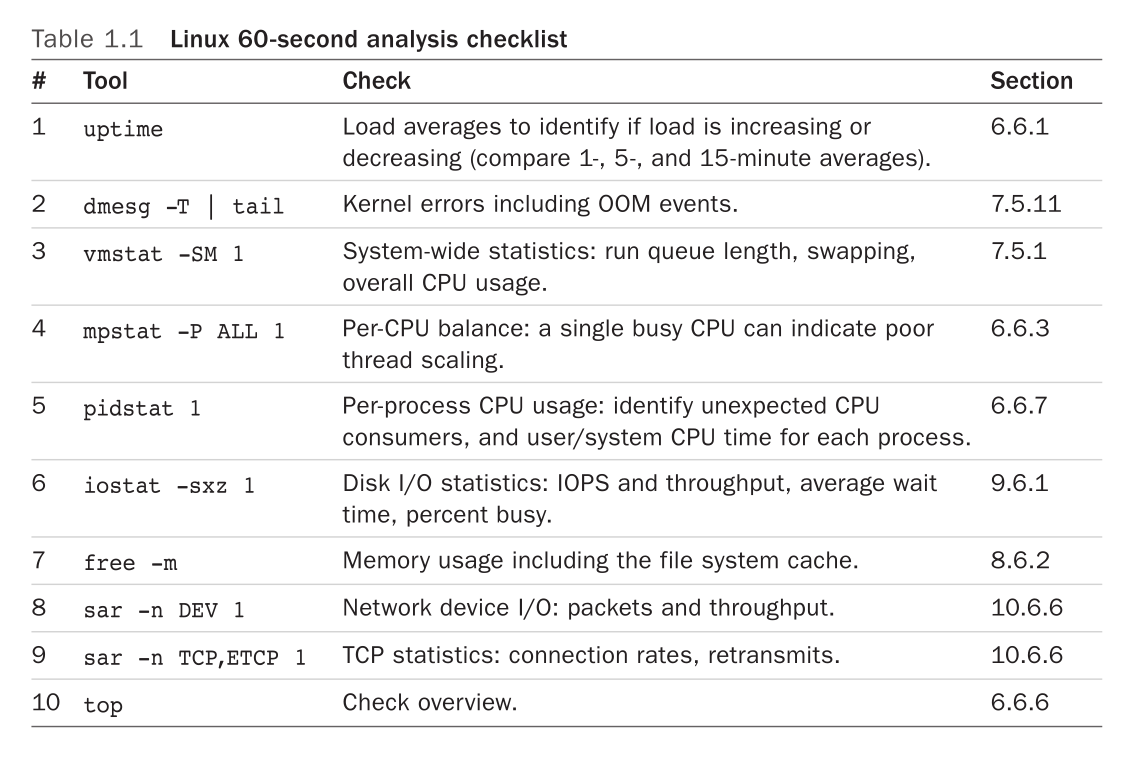
- 60-second checklist:
-
Case studies
- Slow database queries
-
High disk IO, no corresponding CPU spike
-
No disk errors *
He checks disk error counters from /sys; they are zero.
- What counters?
-
Database process is blocking on slow IO (via
offcputime) -
iostatnumbers look like increased disk load -
No increased load from the database
-
Theories:
- fs fragmentation because the disk is close to full (no)
- inode exhaustion?
- page cache hit rate is lower because something else is using up memory (yes, verified via
cachestat)
-
- Slow database queries
2: Methodologies
-
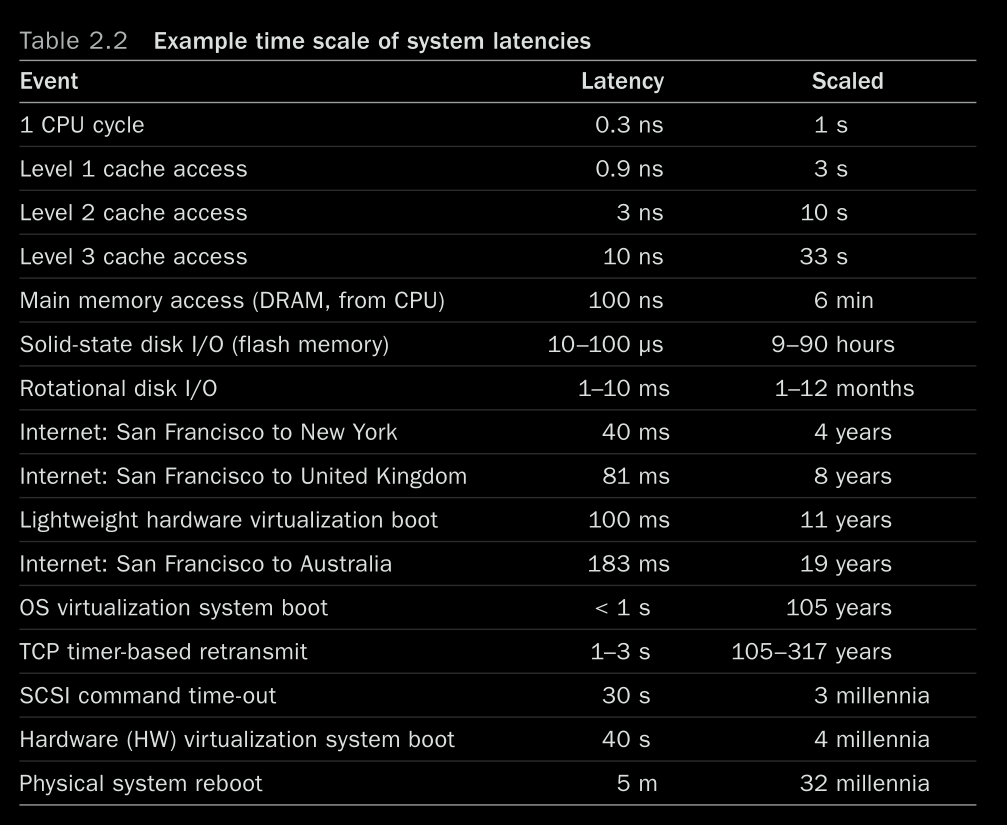
“Latency” on its own is too vague: *
For example, the load time for a website may be composed of three different times measured from different locations: DNS latency, TCP connection latency, and then TCP data2.3 Concepts transfer time. DNS latency refers to the entire DNS operation. TCP connection latency refers to the initialization only (TCP handshake). At a higher level, all of these, including the TCP data transfer time, may be treated as latency of something else. For example, the time from when the user clicks a website link to when the resulting page is fully loaded may be termed latency, which includes the time for the browser to fetch a web page over a network and render it. Since the single word “latency” can be ambiguous, it is best to include qualifying terms to explain what it measures: request latency, TCP connection latency, etc.
-
-
By tuning at the application level, you may be able to eliminate or reduce database queries and improve performance by a large factor (e.g., 20x). Tuning down to the storage device level may eliminate or improve storage I/O, but a tax has already been paid in executing higher-level OS stack code, so this may improve resulting application performance only by percentages (e.g., 20%).
-
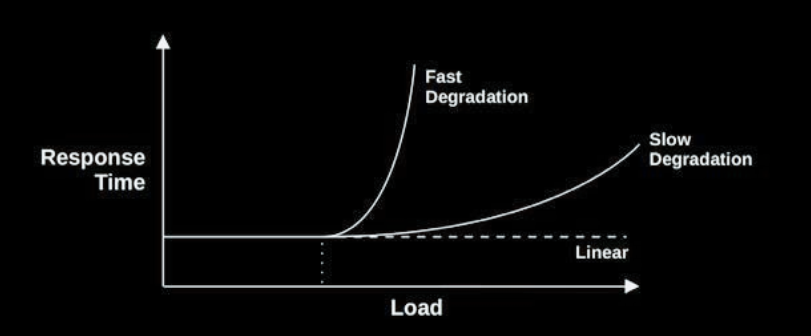
- Examples for issues that may cause “fast degradation”: system is out of memory and pages are evicted to disk/swap, saturated (rotational) disks
- Examples for issues that may cause “slow degradation”: CPU load
-
Utilization: % of time the resource is in use (or % of stated capacity in use)
-
Saturation: degree to which a resource is unable to accept more work (at 100% utilization)
-
Workload analysis vs. resource analysis
-
-
Methodologies
-
Scientific method: hypothesize, test, validate/discard hypothesis based on data
-
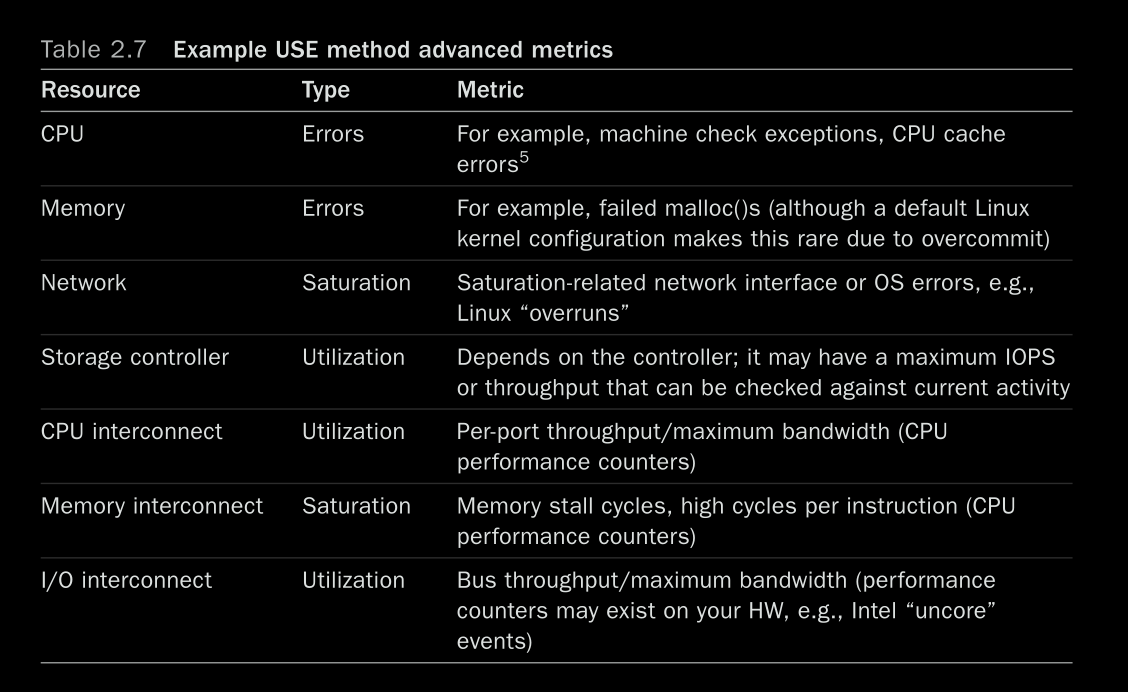
USE method
- For every resource, check utilization, saturation, and errors
- Utilization is time-based (% of time the resource is busy) or capacity-based (% of the rated capacity that’s being used) based on the type of resource
-
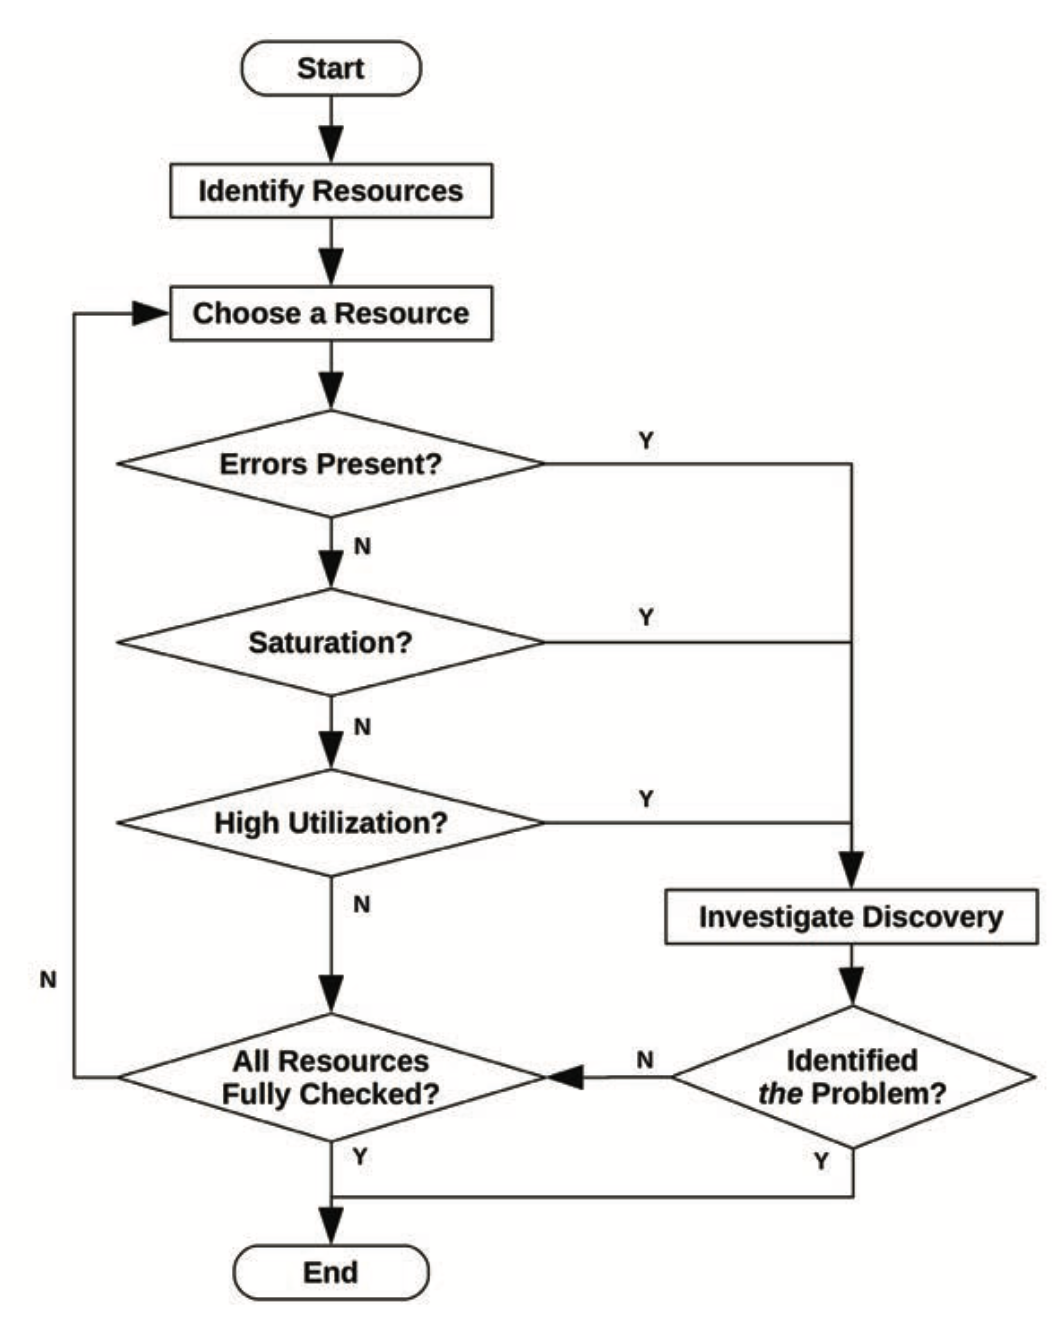
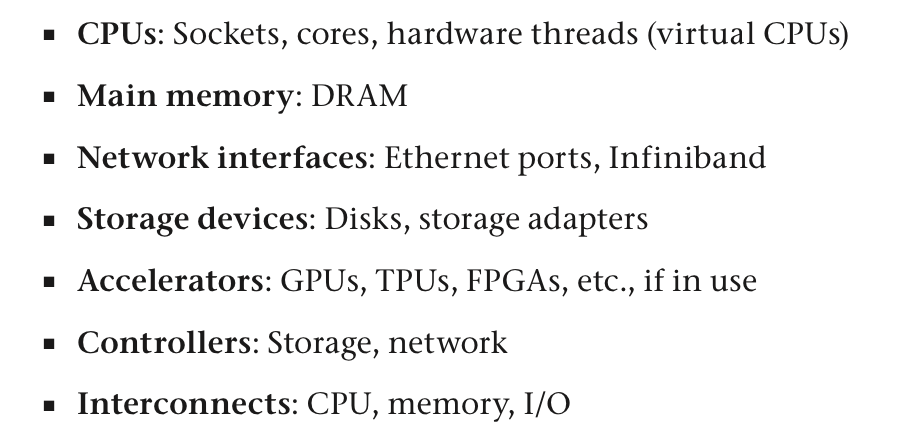
- Examples of resources to check:
- Suited to resources that degrade at high utilization/saturation (unlike caches, where perf improves as utilization goes up)
- Some combinations are harder to check:
-
RED method
- Specific to microservices
- For each service, check the request rate, errors, and duration
-
the USE method for machine health, and the RED method for user health
-
Workload characterization
- Examine the load being applied, not the system itself
-
-
Drill-down analysis
- Monitoring for an initial sign that something is wrong (grafana, etc.), eliminate & narrow down on a single system (grafana/etc. but also things like vmstat/htop on single machines), root-cause (tracing/debugging/eBPF/etc.)
-
Latency analysis
- Starting with a broad latency issue, narrow/eliminate until a single slow system is revealed
-
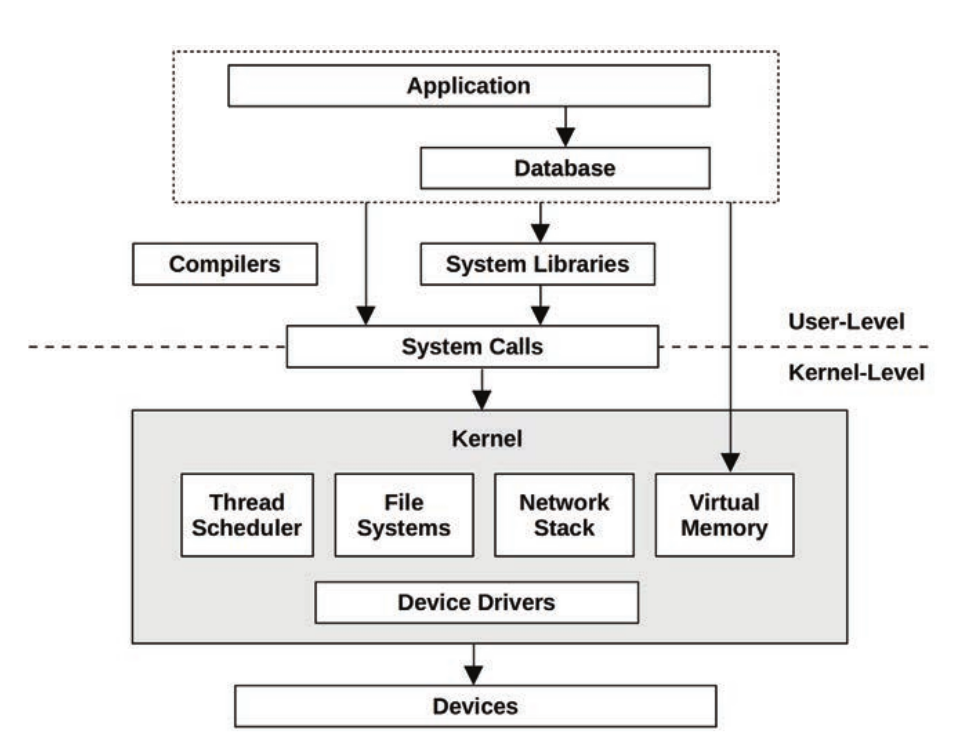
3. Operating Systems
-
This seems to be a more Linux-centric overview of the concepts from
BookOperating Systems - Three Easy Pieces -
-
Applications can call syscalls directly (like Go, mostly) or via a library like glibc
-
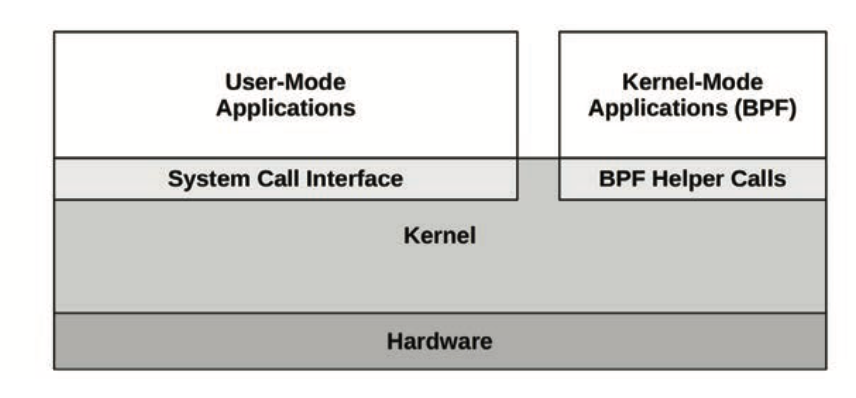
Linux now allows BPF code to run in kernel-mode
-
-
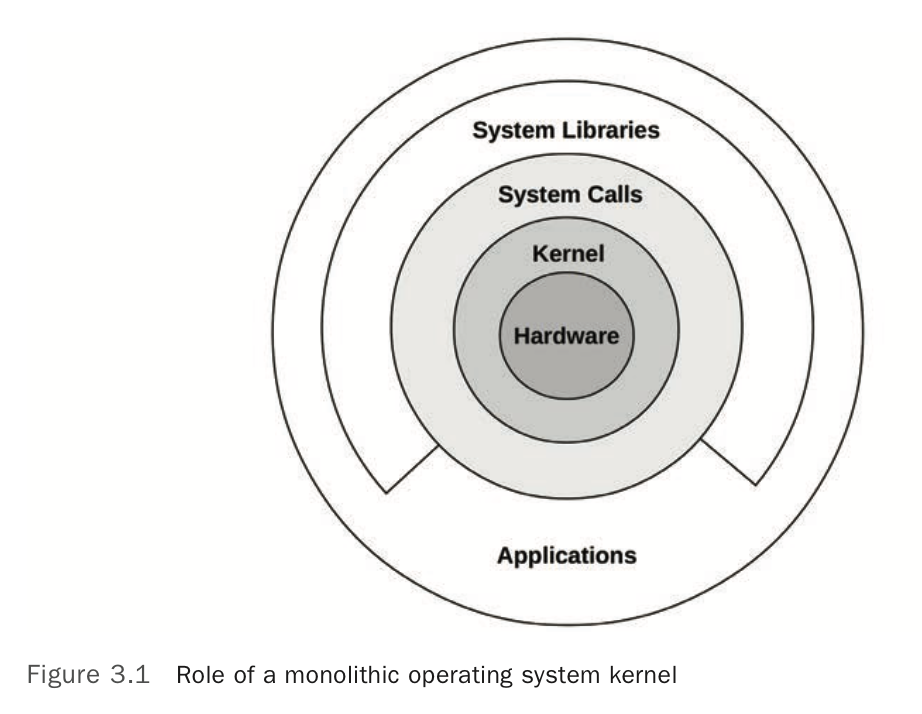
Processors use privilege rings to implement the user-mode/kernel-mode split
- x86 supports 4 privilege rings (0-3)
-
All syscalls cause a mode switch, and may also cause a context switch
-
Switches are expensive, so there attempts to avoid them like:
- mmap: use memory-mapping to read a file without syscalls (although every page fault causes a mode switch)
- User-mode syscalls: use a vDSO that is mapped into the process address space. a vDSO is a shared object that implements some syscalls (like
gettimeofday). Processes can call these without syscall overhead. - Kernel bypass: allows processes to access devices directly (is this similar to memory-mapped IO?)
- Kernel-mode applications: BPF
-
ioctl(2)is used to request “miscellaneous actions” from the kernel against a file descriptor. For example,perfuses theperf_event_opensyscall to return an FD, and all further interactions are done via ioctls on the FD -
IO
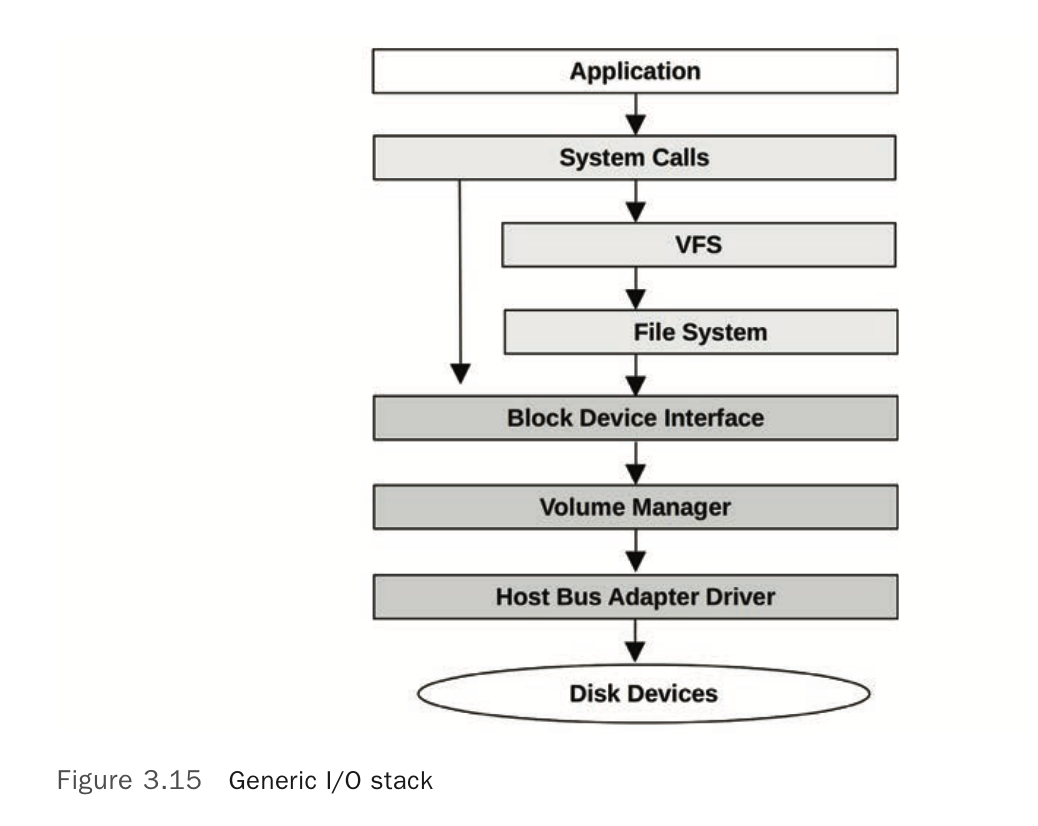
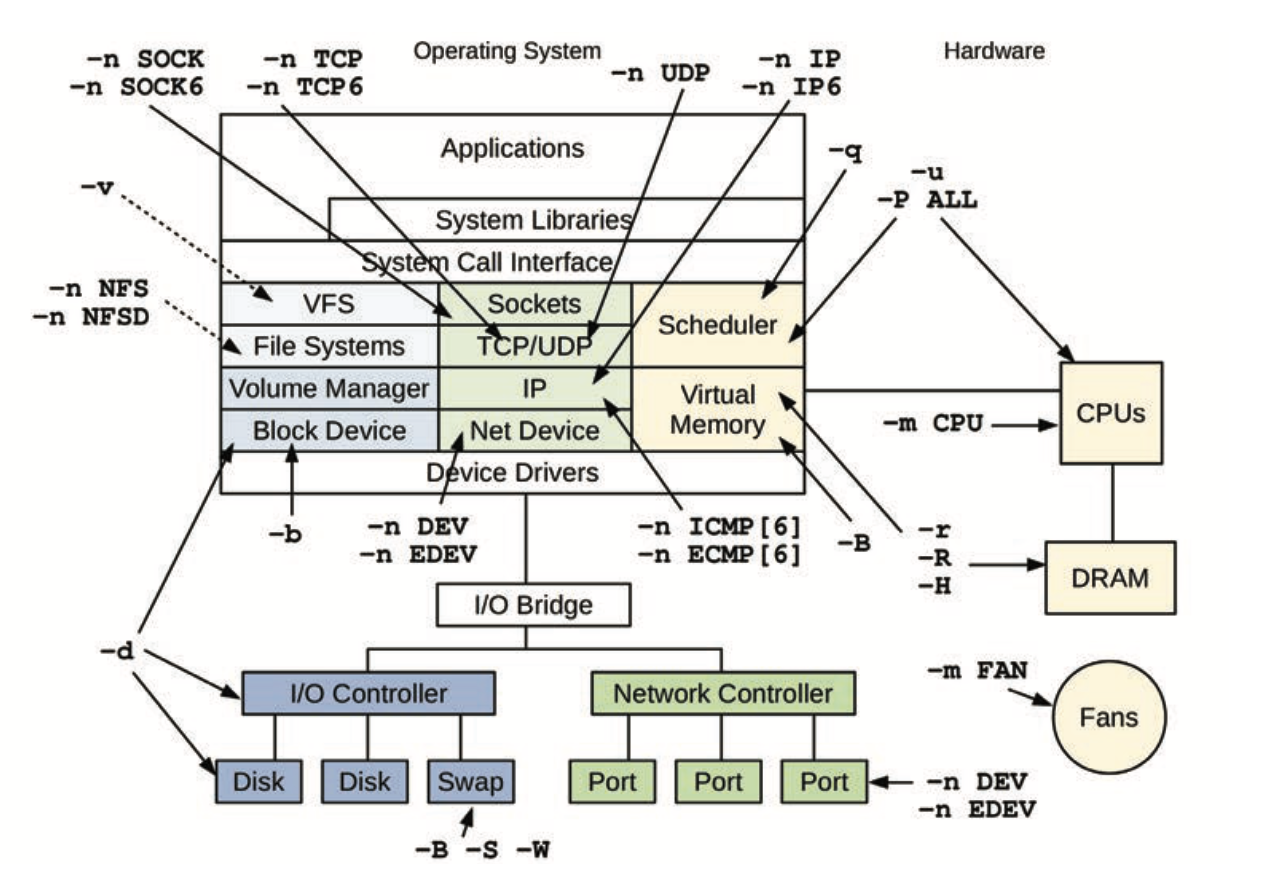
- For storage-device-based file systems, the path from user-level software to the storage device is called the I/O stack.
-
-
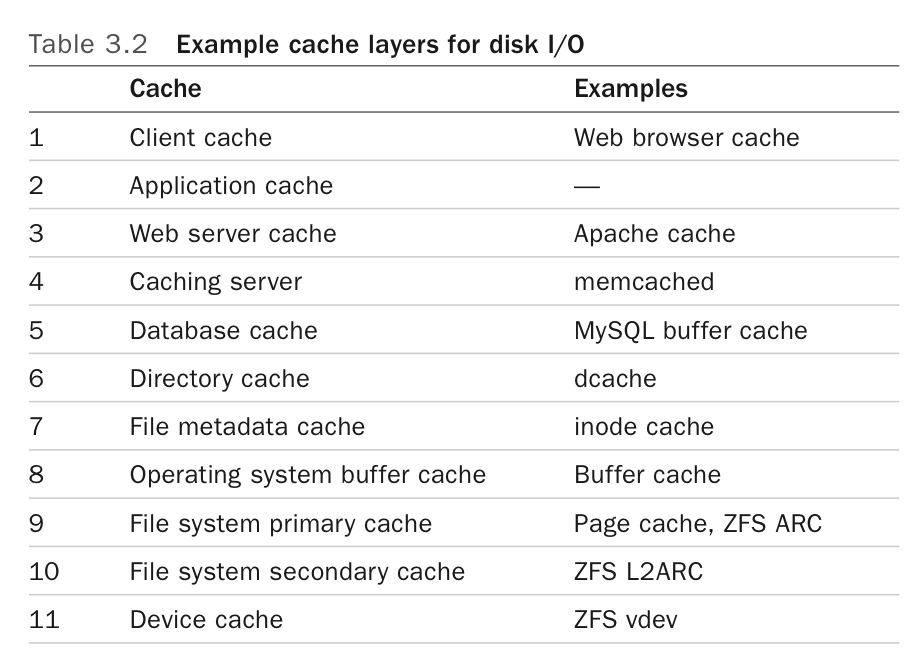
Caches
- Levels
-
-
For a multiprocessor system, there are times when CPUs need to coordinate, such as for cache coherency of memory translation entries (informing other CPUs that an entry, if cached, is now stale). A CPU can request other CPUs, or all CPUs, to immediately perform such work using an inter-processor interrupt (IPI) (also known as an SMP call or a CPU cross call). IPIs are processor interrupts designed to be executed quickly, to minimize interruption of other threads.
- Levels
-
systemd
systemd-analyze critical-chainfor boot dependenciessystemd-analyze blamefor slow-starting units
-
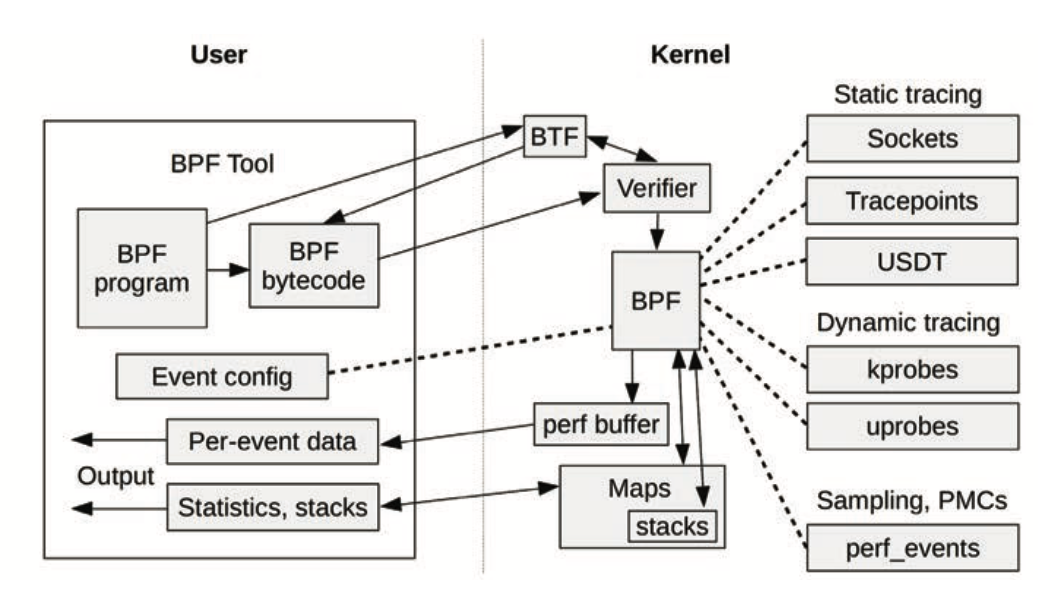
BPF
-
Interrupts
-
-
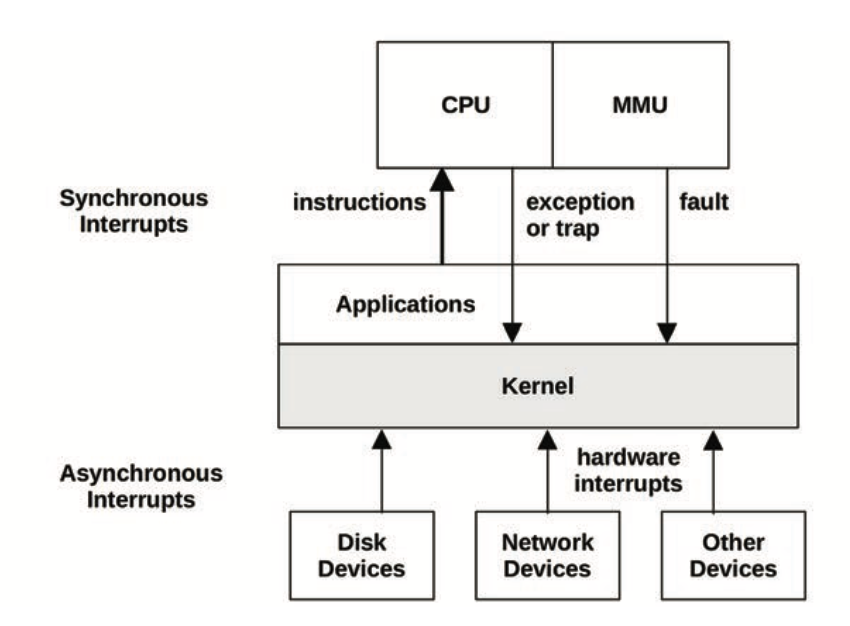
Async interrupts arrive as IRQs
-
Types of sync interrupts: traps (deliberate call into the kernel), exceptions (divide by zero, etc.), and faults (page faults, etc.)
-
Interrupt service routines (ISRs) need to run very quickly (because they block other interrupts and user code); any intensive work can be done later (bottom half) in a kernel thread
-
Linux network drivers, for example, have a top half to handle IRQs for inbound packets, which calls the bottom half to push the packet up the network stack. The bottom half is implemented as a softirq (software interrupt).
-
Specific interrupts/IRQs can be masked, although some interrupts are non-maskable
-
When there is no work for the CPUs to perform, the kernel schedules a placeholder thread that waits for work, called the idle task. The linux idle task can call the
hltinstruction to power down the CPU until the next interrupt.
Processes
- Linux CC libraries typically implement
forkas a wrapper aroundclone(2) - Lifecycle:
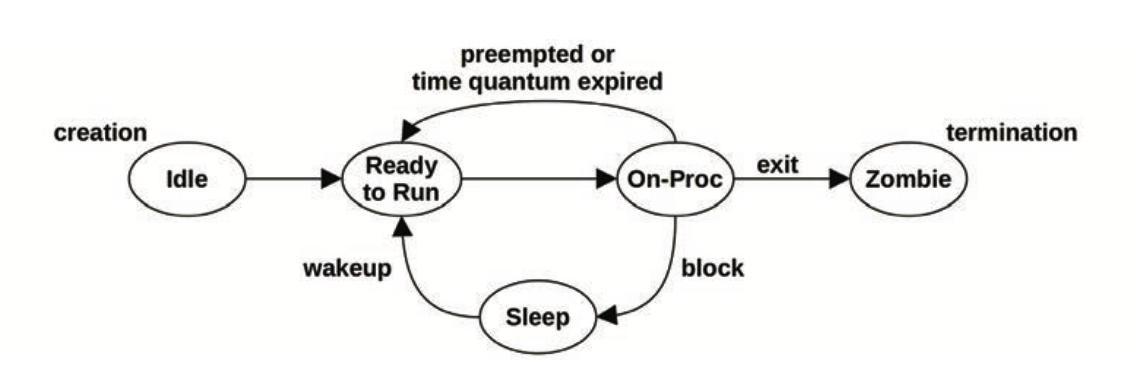
- Environment:
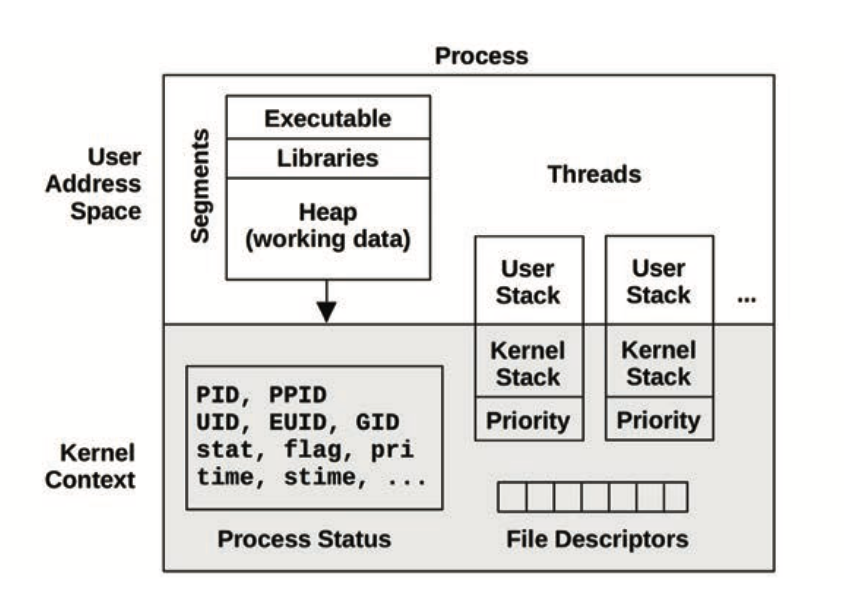
Stacks
- User-level and kernel-level stacks
- When a syscall is made, the user-level stack doesn’t change until the syscall returns.
-
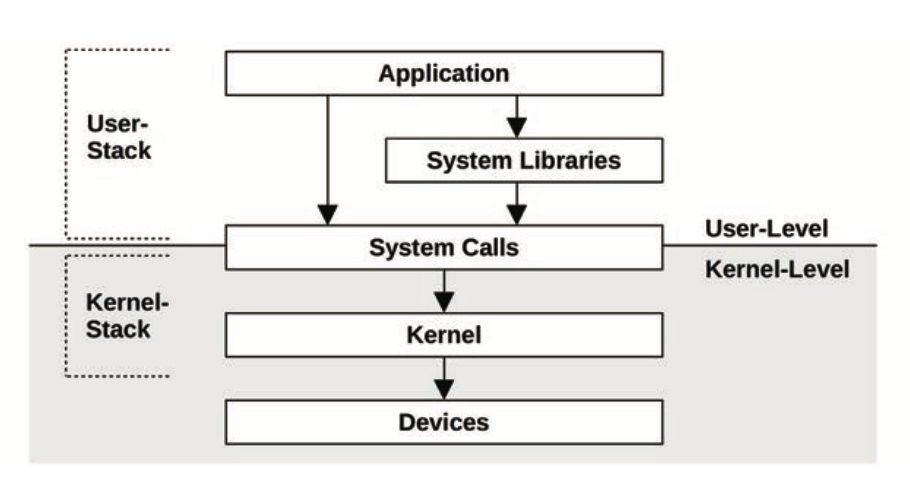
- Each thread gets a user stack and a kernel stack, and Linux also has some global stacks (like ones for interrupts)
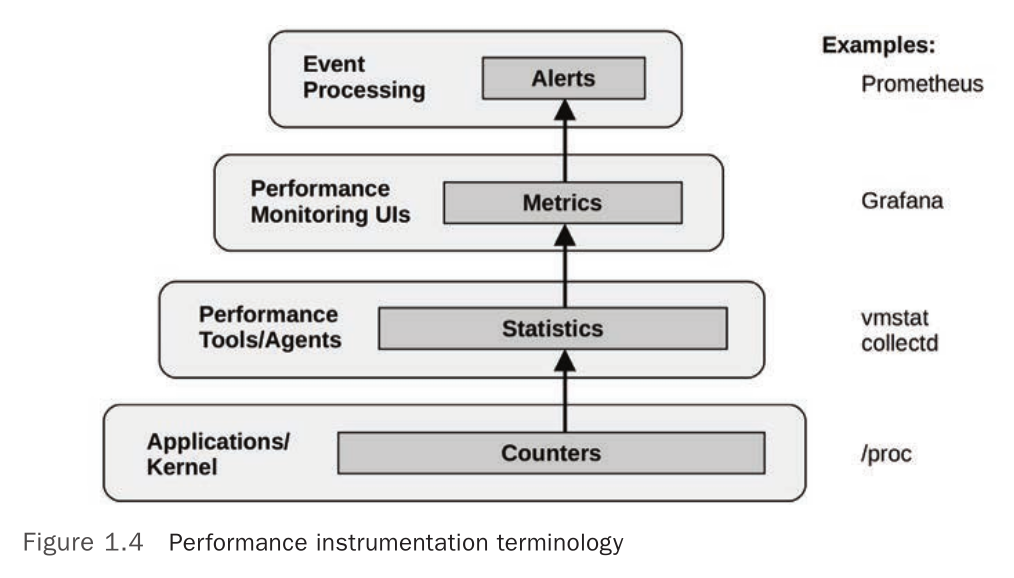
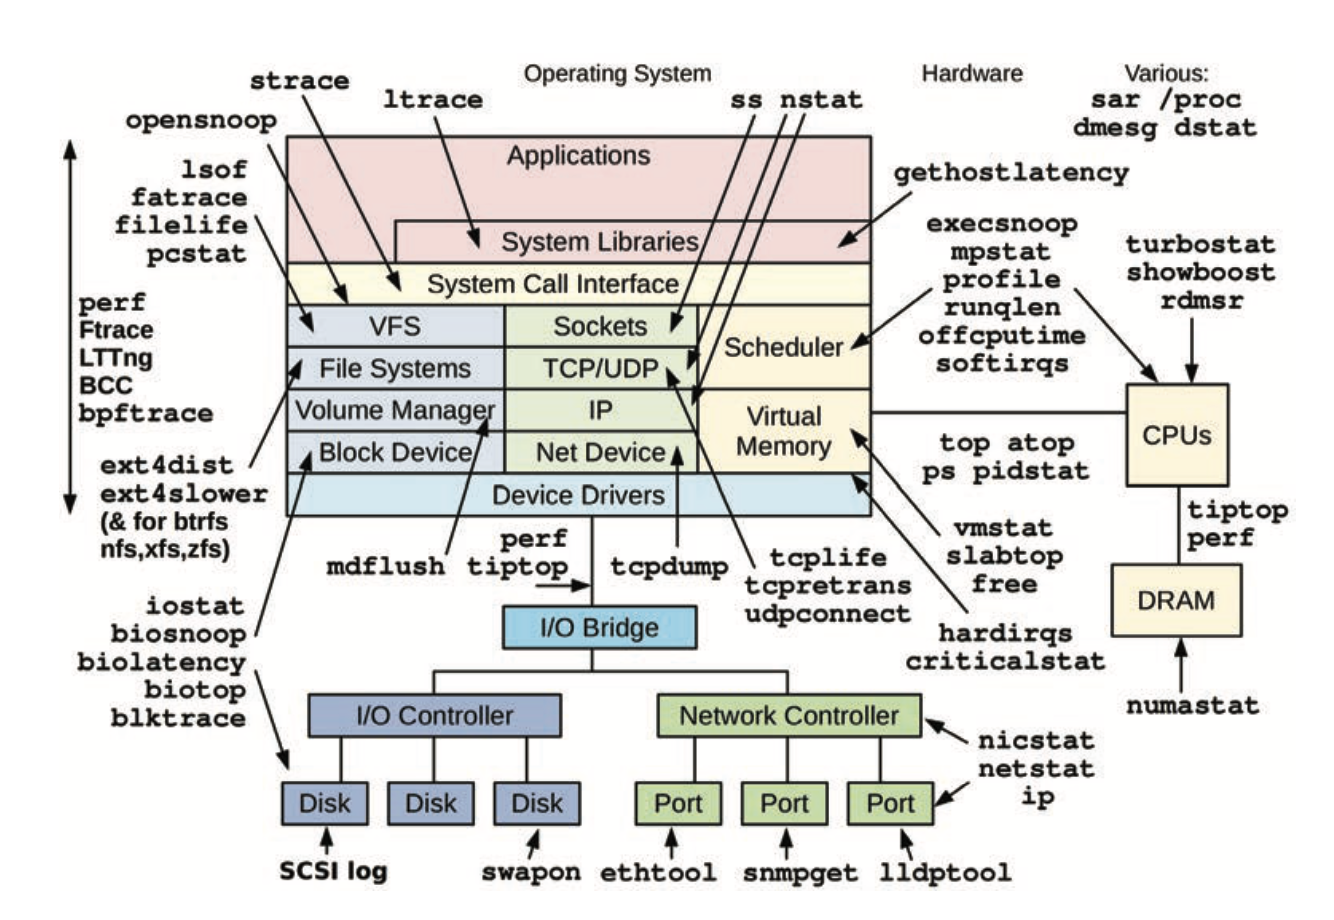
4. Observability Tools
- Workload:
- Static:
- Useful tools to have installed for a crisis:
- sysstat
- util-linux (dmesg, lsblk, lscpu)
- procps (ps, vmstat)
- iproute2 (ip, ss, nstat)
- numactl
- linux-tools-common (perf)
- bcc-tools
- nicstat
- ethtool
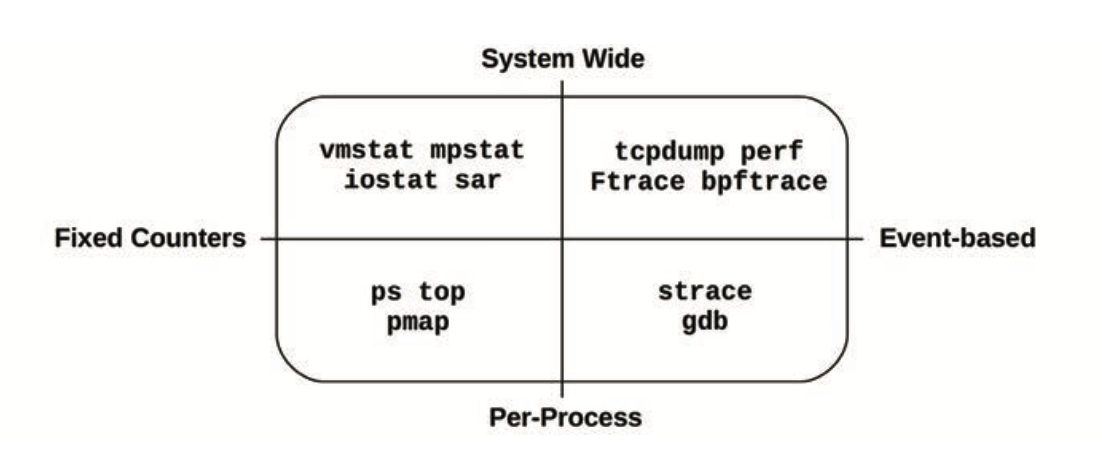
- Tool types
-
- Tracing: instrument every occurrence of an event
- Profiling: collect samples against a target
Sources of observability
-
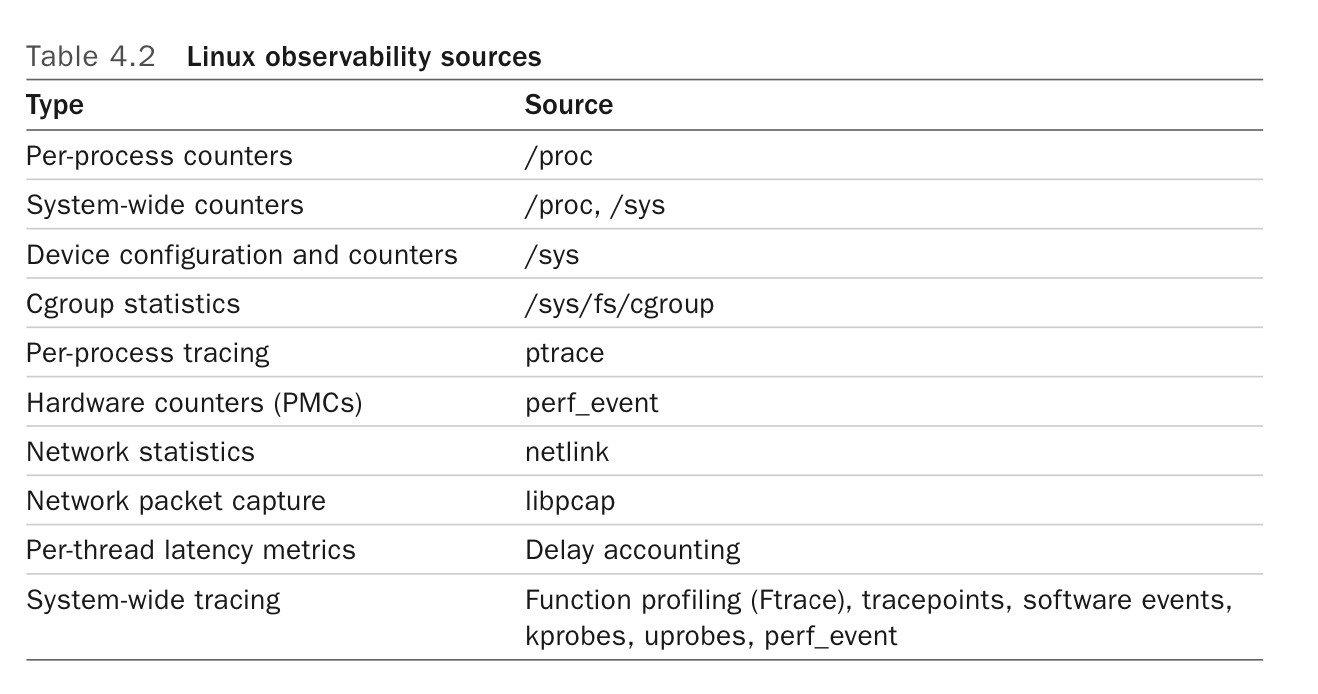
- /proc/PID
- stat, statm, status
- maps, smaps
- /proc
- cpuinfo
- diskstats
- interrupts
- meminfo
- net/dev, net/netstat net/tcp
- pressure
- stat
- netlink
- Use a special AF_NETLINK socket to fetch kernel info
- More efficient than proc, supports notifications
- tracepoints
/sys/kernel/debug/tracing/eventsfor a list- Predefined instrumentation points in the kernel
perf list tracepoint
- kprobes
- Trace any kernel function or instruction
- kretprobes to trace return from kernel functions
- uprobes
- Like kprobes but for userspaceA
- Also uretprobes
- USDT
- User-space version of tracepoints
- Applications like Java and Postgres (and libc) have added tracepoints this way
- PMCs
- Hardware counters, measure things like CPU instruction efficiency and hardware cache efficiency
perf statexposes some of this
sar
5. Applications
- Entry points into application perf (or general) debugging:
- Config file (look for tunables/etc.)
- Execution context: bare-metal, hardware topology
- Metrics: how/where are they exported
- Logs
- Version: is this the latest version of the application
- Issue/bug database
- Source code
- Techniques
- Increase IO sizes to increase throughput, at the cost of latency and cache space
- Caching (at all levels, from the hardware, to the OS, to the application and its dependencies)
- Buffering/buffer sizes have the same tradeoff as IO sizes
- Polling vs. evented IO (latency vs. wasting a CPU)
- Concurrency styles
- Use multiple OS threads/processes and let the OS schedule them
- Use app-level threads of execution multiplexed onto a single (or multiple) OS thread. The app/process is now in charge of scheduling. This generally only works with async IO. Examples: fibers, coroutines, evented concurrency
- Linux mutexes have three paths
- fastpath: acquire the lock using
cmpxchg, only succeeds if the lock is free - midpath: spin on CPU waiting for the lock
- slowpath: blocks and unschedules the thread, to be woken up when the lock is available
- fastpath: acquire the lock using
- Linux RCU
- Read-copy-update
- Allows lock-free reads
- Writes create a copy
- Linux async IO
- open(2)
- io_submit(2)
- sendfile(2)
- io_uring_enter(2)
- Programming Languages
- Binaries commonly use the Executable and Linking Format (ELF) on Linux
- Use the
process_vm_readvto spy on an interpreter’s memory space for program context during instrumentation/tracing - GC involves some CPU cost, and also causes latency outliers
Methodologies for application observability
-
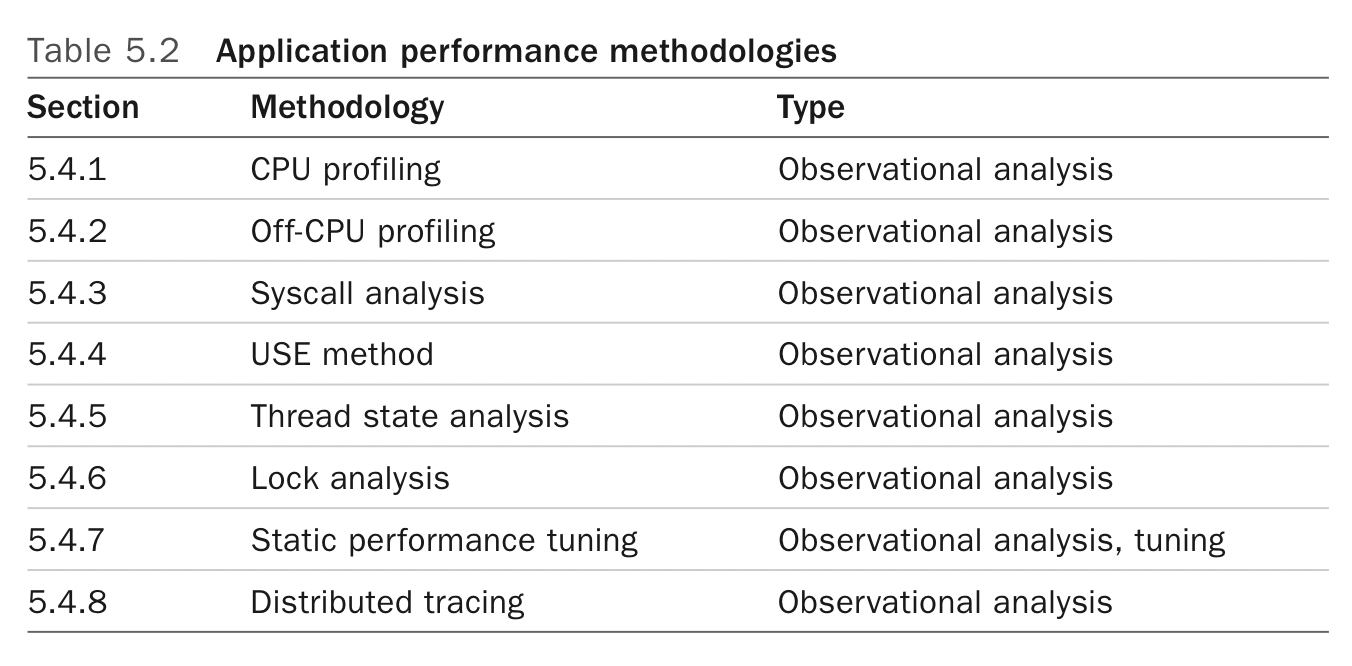
- CPU profiling
- Collect stacktrace samples at some frequency, and then use a tool (like flamegraphs) to make sense of them
- Some profilers like perf can capture stack traces across user-mode and kernel-mode
- Off-CPU analysis
- Track threads/processes that are currently not running
- Either by sampling, tracing the scheduler, instrumenting blocking code paths at the application level
- Sampling is more expensive than CPU profiling because rather than sampling a fixed number of CPUs, you have to sample a potentially unbounded set of processes that are not running
- Sometimes hard to distinguish between threads that are idle waiting for work (stuck in
acceptfor example) vs. threads that are idle waiting for work to complete (waiting forfsyncfor example) - Focusing on
TASK_INTERRUPTIBLEis one (imperfect) strategy to filter out off-CPU traces that don’t matter
- Syscall analysis
- Trace
execveto log new processes being executed - Trace IO syscalls to trace all system IO
- Tracing a lot of syscalls can lead to high %sys though
- Trace
- Thread state analysis
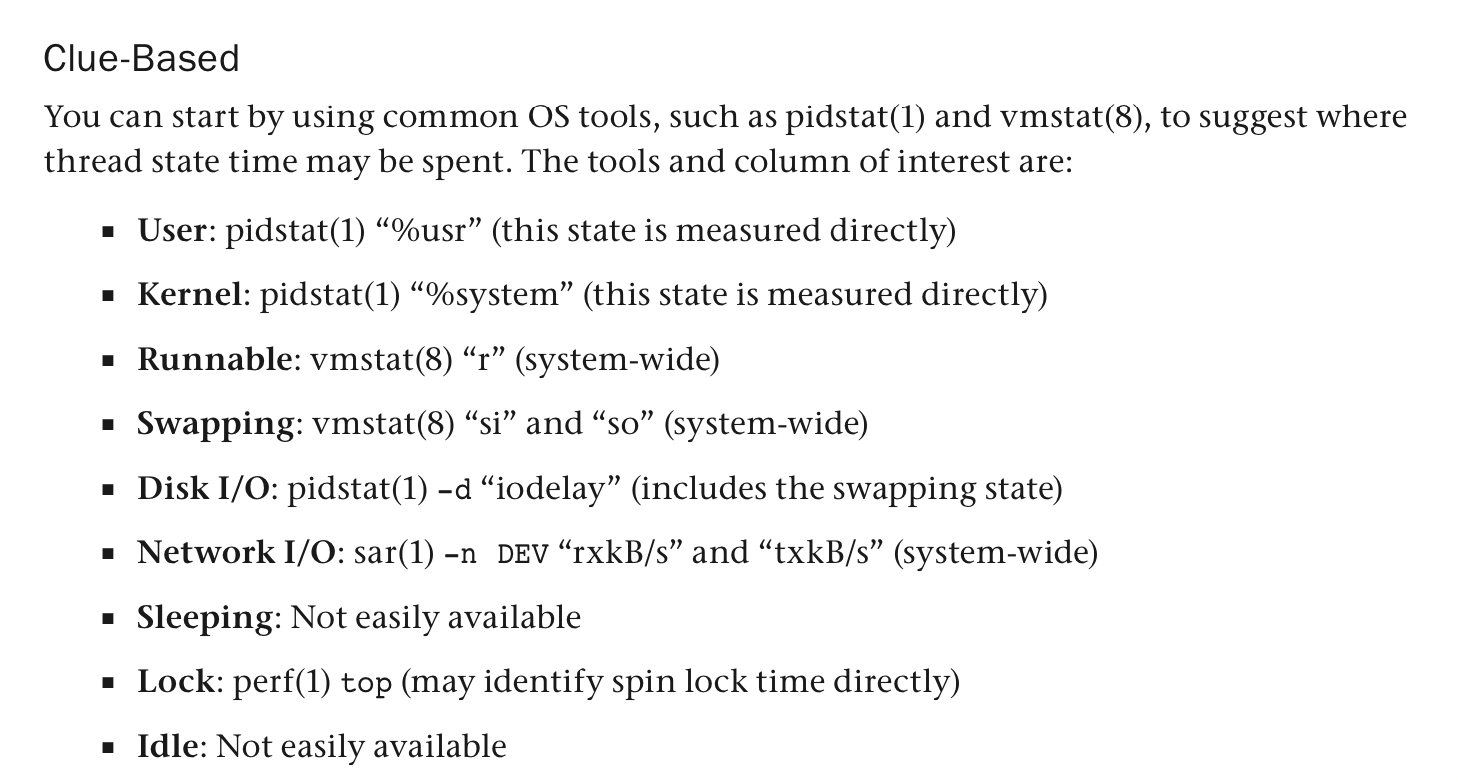
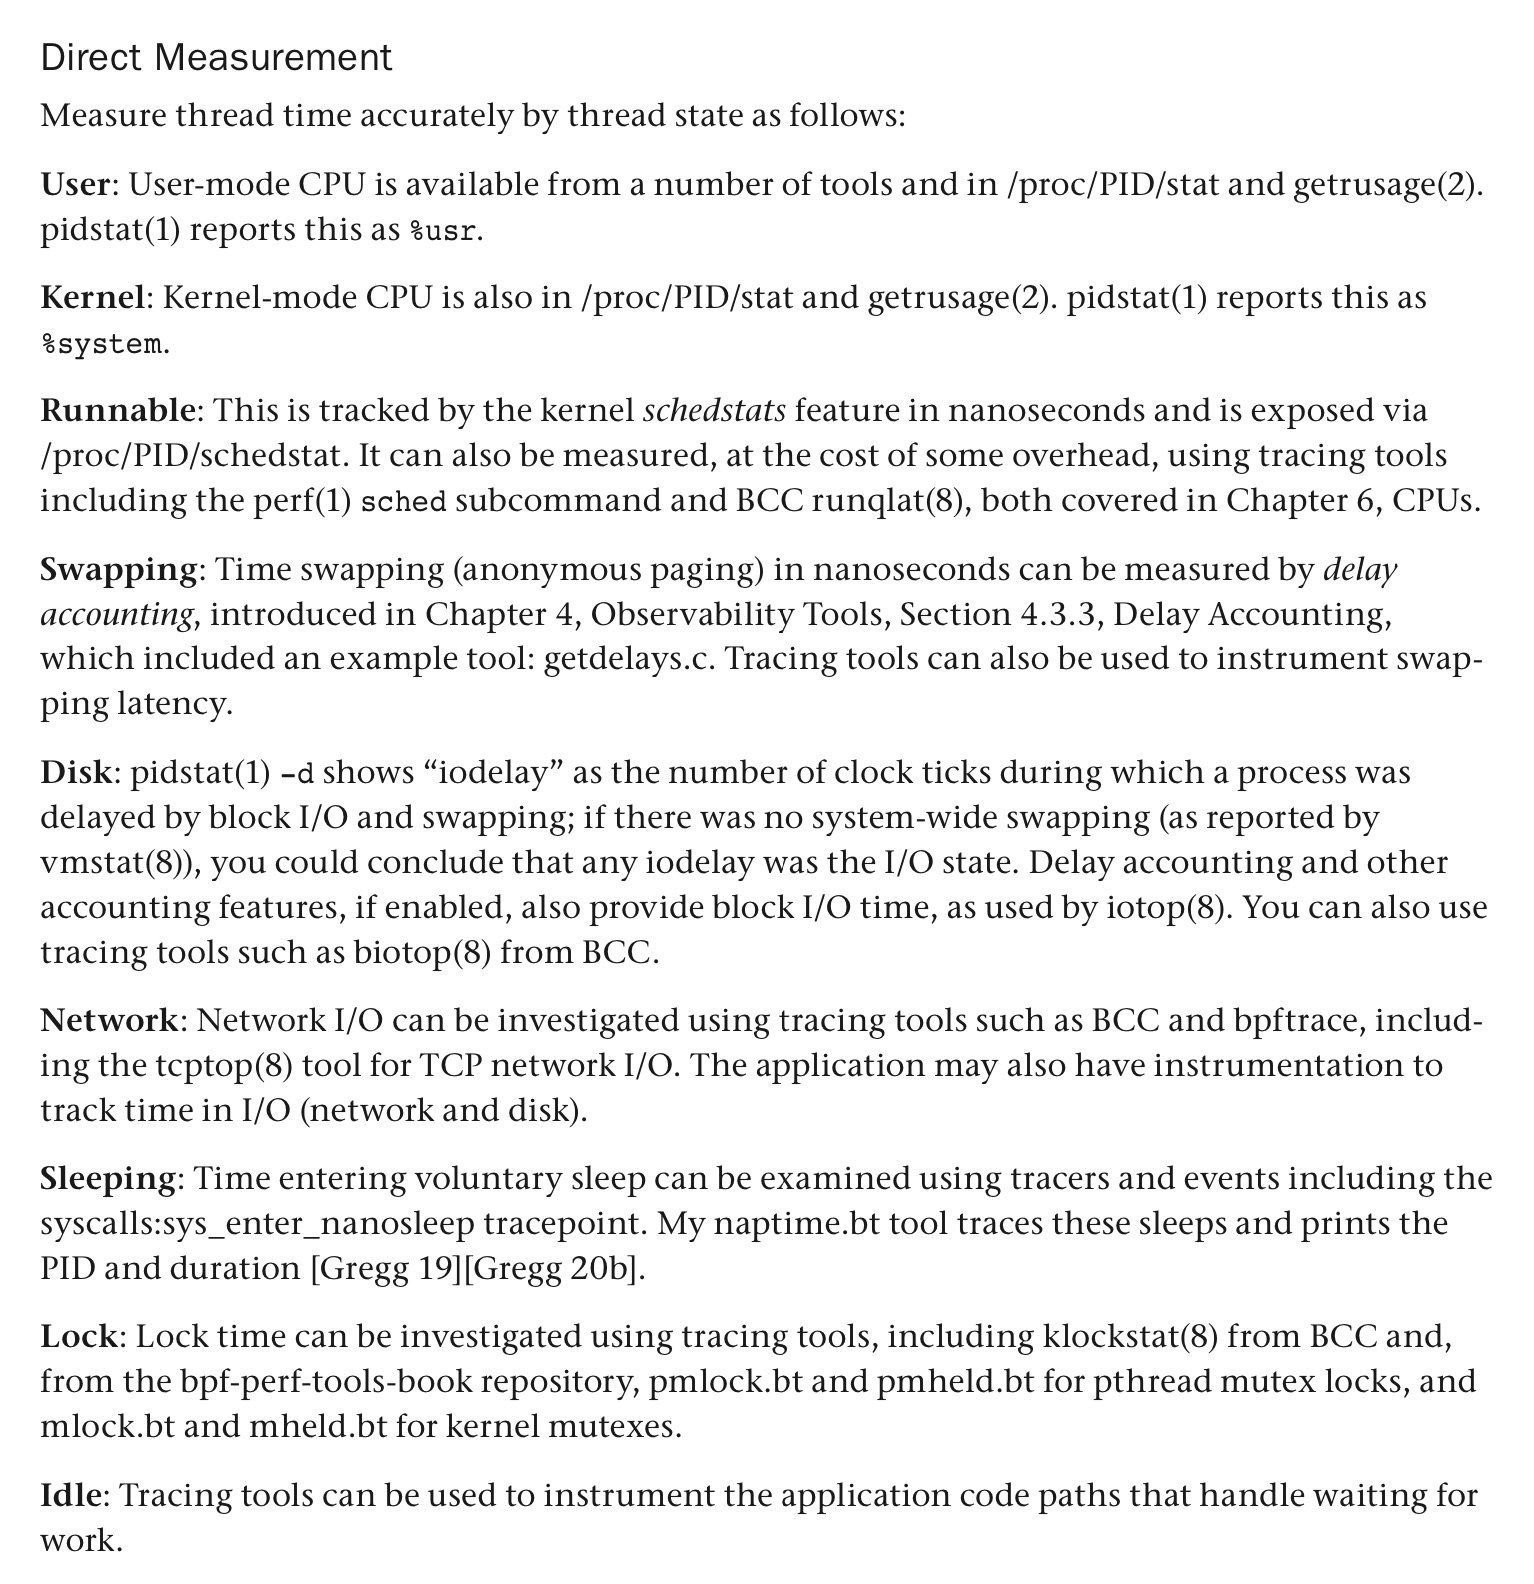
- Nine states a thread can be in: user, kernel, runnable, swapping, disk IO, net IO, sleeping, lock, idle
-
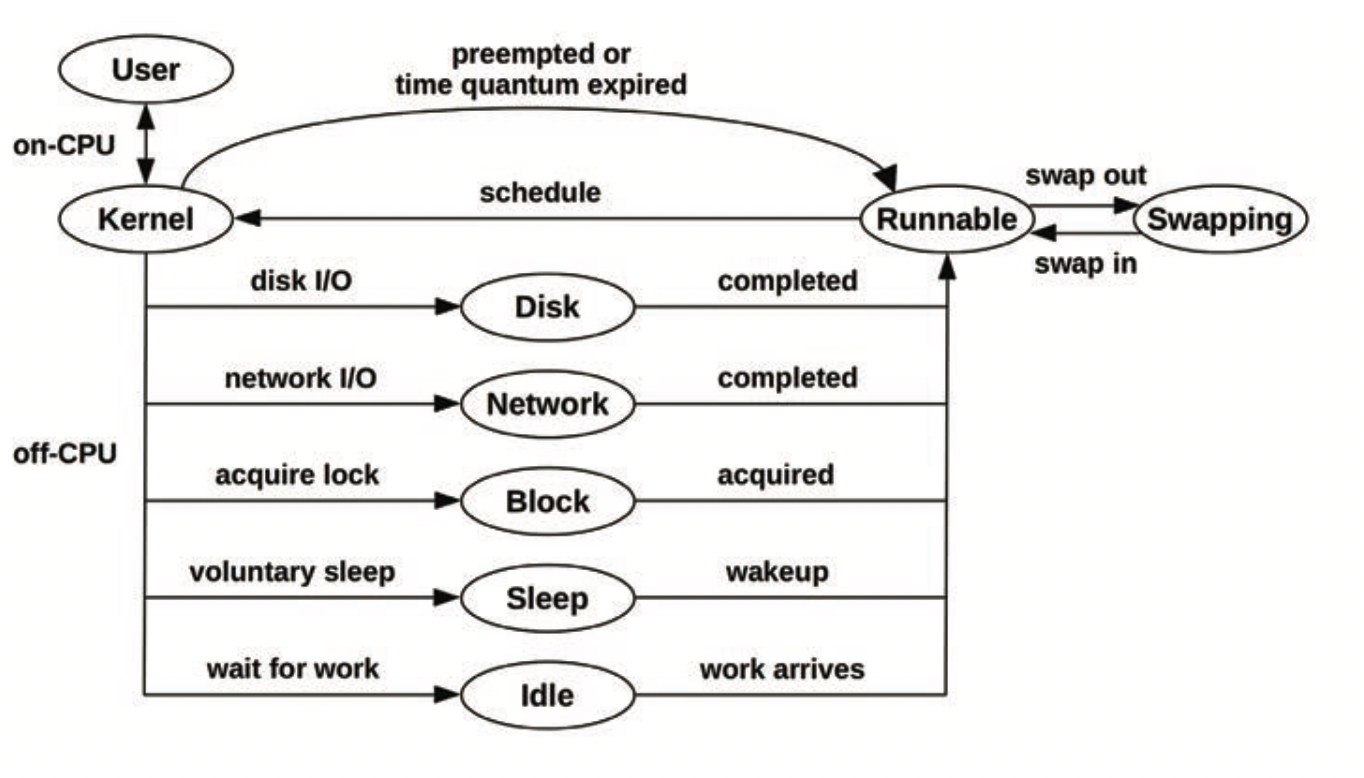
- Figure out what states an application’s threads are in and use this to guide next steps
- On Linux, look at
stateintask_struct(TASK_RUNNING, TASK_UNINTERRUPTIBLE, TASK_INTERRUPTIBLE)- This gives you an initial clue but isn’t granular enough for the nine categories ^^^^^
- Use these other tools to drill down further, although all these tools don’t give you visibility at the level of a single process:
-
Observability Tools
-
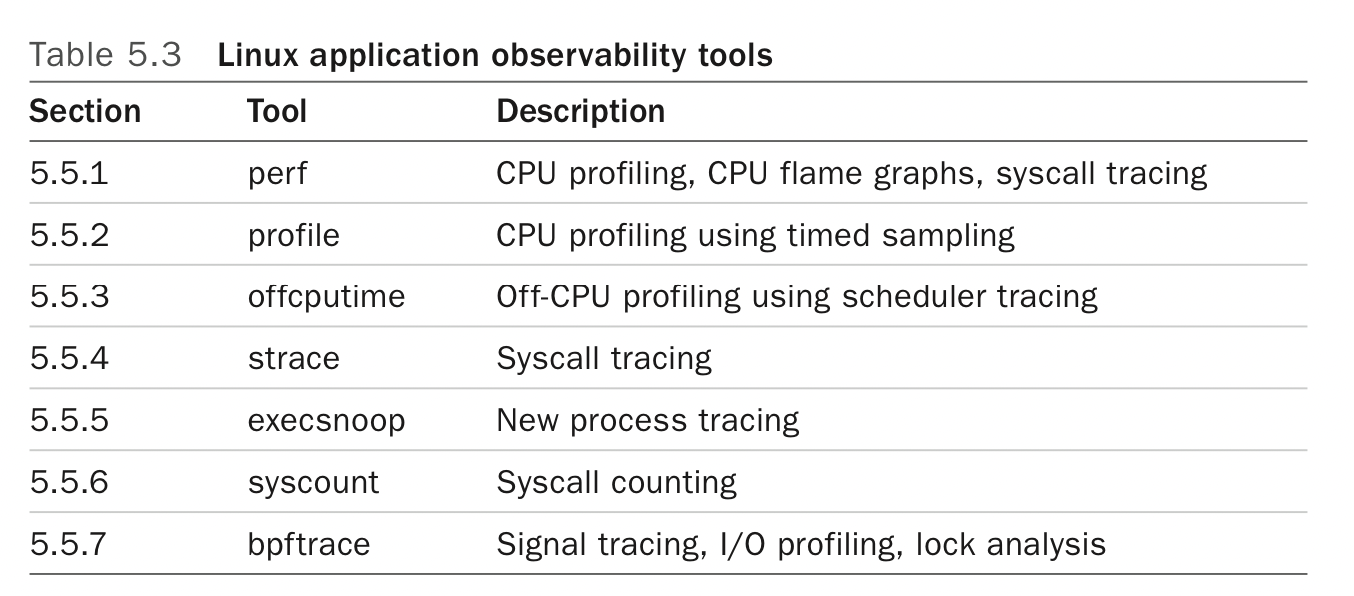
- strace has significant overhead over
perf trace perf tracecan trace page faults
6: CPUs
- Per-CPU run queue for cache warmth via CPU affinity, but also for memory locality on NUMA systems
- The CPU’s clock rate is the number of clock cycles it can perform per second
- A faster clock rate is not going to help if most of your instructions are stalled on memory access (or worse, on page faults)
- Executing an instruction involves:
- Instruction fetch
- Instruction decode
- Execute
- Memory access (+ possible page fault)
- Register writeback
- Each of these steps takes at least a single clock cycle to complete, and memory access is typically the slowest
- Cycles spent waiting for memory are stall cycles
- Pipelining: execute multiple instructions in parallel by executing different components of different instructions at once
- Speculative execution: execute later instructions while waiting for an earlier stalled instruction to finish
- Branch prediction: speculative execution by guessing the outcome of a branch
- Hyperthreads: multiple threads per core, by scheduling between them during instructions (wow!)
- The best performance is typically had by only using one thread per core
- Workloads that are heavy on stall cycles (low IPC) may benefit from hyperthreads
- IPC: instructions per cycle
- CPU utilization typically includes memory stall time
- A CPU running at saturation is less of a problem than other resource types, as higher-priority work can preempt the current thread.
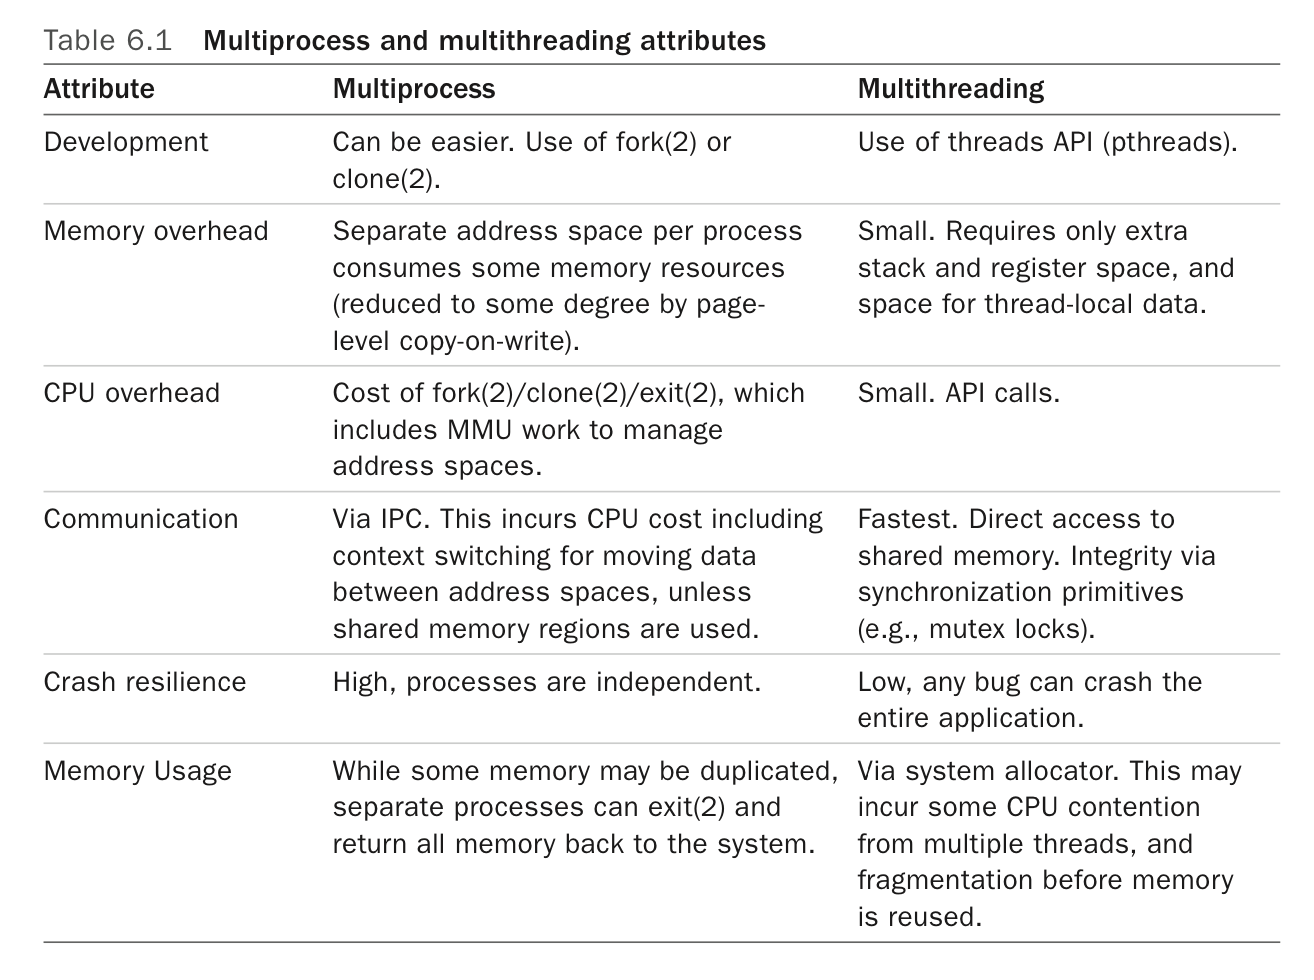
- Multiple processes vs multiple threads:
- Processor components (2 cores):
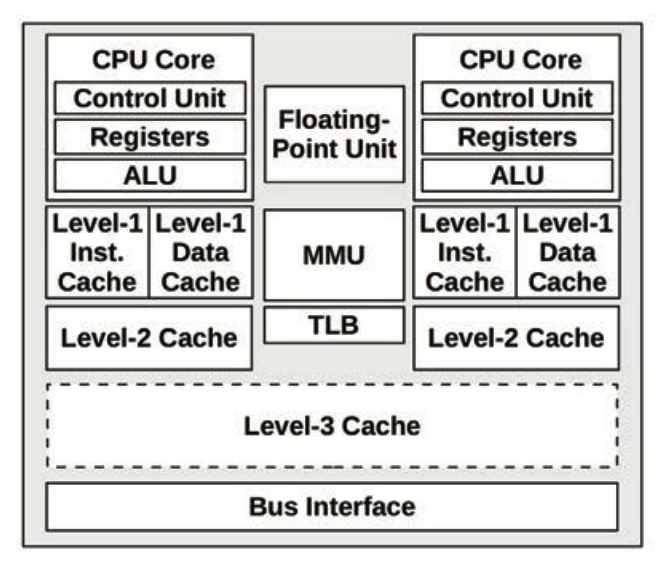
CPU caches
-
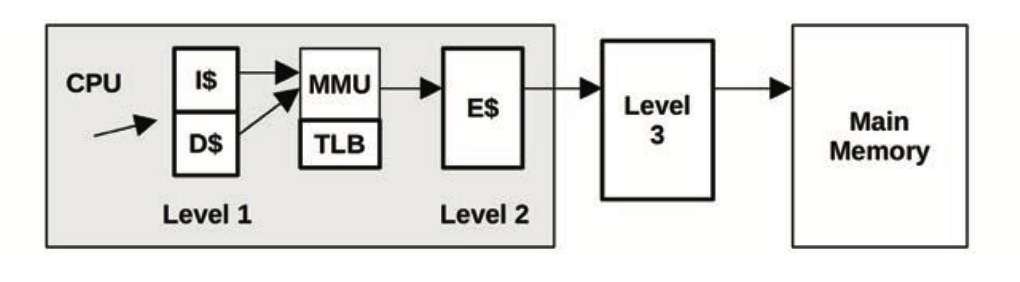
- Why does the TLB not sit between L3 and main memory?
- Because the L2 cache and onwards are physically addressed
- Associativity: a measure of where in the cache a given object can be placed
- Fully associative: anywhere
- Direct mapped: only a single location (hash fn, for example)
- Set associative: hash to a set of locations, any of which is a valid location for the object. A 4-way set associative cache allows for 4 different locations per object.
- Cache lines are the unit of transfer from main memory, and are typically 64 bytes long.
- Coherency
- The same memory location may be cached in multiple caches (different levels of the same CPU OR caches across multiple CPUs)
- When the CPU dirties this cache entry, all other caches with this entry must be invalidated.
- The MMU handles virtual-to-physical address translation
-
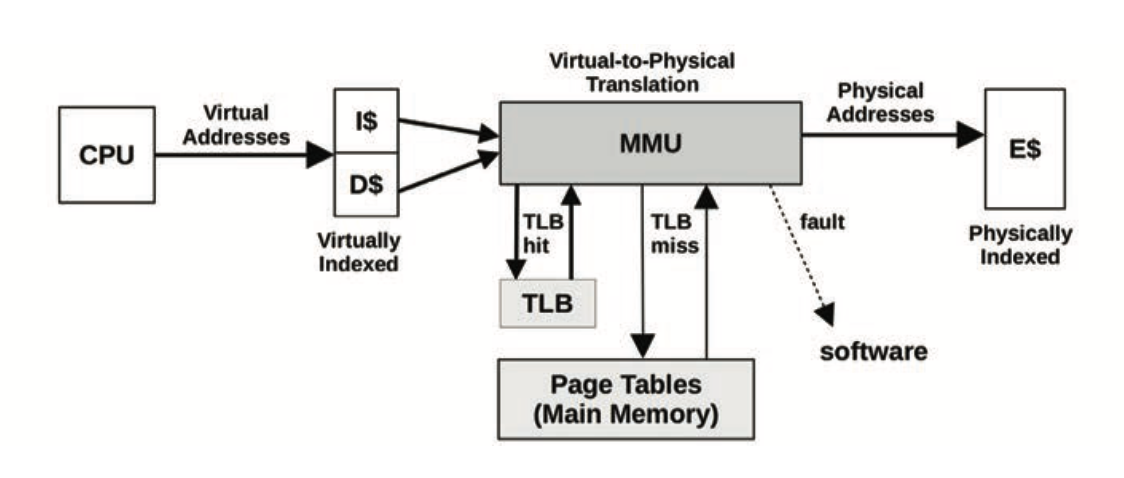
- Here the MMU sits between L1 and L2. L2 is indexed via physical addresses, so virtual addresses need to be converted first.
- I’m guessing this is because L2 is shared and L1 is not (?)
-